NBA 3-Pointer Prop Bets: Pricing Perimeter Shooting Markets
 Available in US
Evaluating 3-Point Volume for NBA Prop Markets
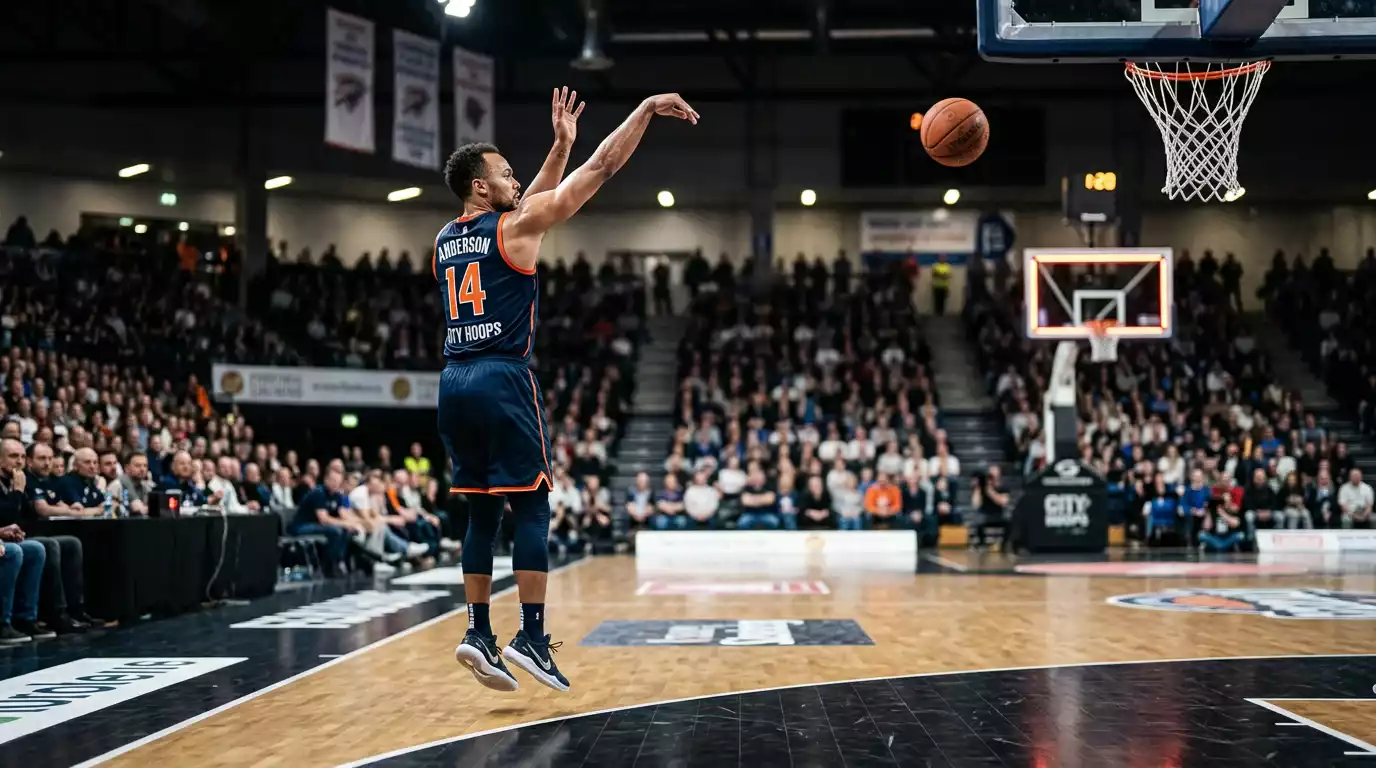
Six years ago, NBA teams averaged about 32 three-point attempts per game. In the 2025-26 season that number sits closer to 37. The three-point shot has reshaped basketball strategy, offensive design and roster construction — and it has created one of the most volatile, most mispriced, and most rewarding prop markets available to UK bettors. I have a love-hate relationship with three-pointer props because they can make you feel like a genius or an idiot on any given night, and the variance is baked into the mathematics of the bet itself.
Three-pointer made (3PM) props ask you to predict whether a player will hit over or under a specific number of threes. For a volume shooter, that line might be 3.5. For a secondary shooter, 1.5 or 2.5. The lines look simple but the distribution underneath is anything but. A player who averages 3.0 threes per game does not produce that number consistently — he hits five one night, one the next, four the night after, and zero the night after that. The standard deviation on three-point makes is significantly higher than for points or assists, and that variance is the defining feature of this prop market.
How 3PM Prop Lines Are Set
The bookmaker sets a three-pointer prop line using the player’s season average, recent form, and the opposing team’s three-point defence. If a player averages 3.2 threes per game and is facing a team that allows above-average three-point shooting, his line might be set at 3.5 with the under slightly favoured. If the opponent is elite at defending the perimeter, the line might drop to 2.5.
What the line does not fully capture is shot-quality context. A catch-and-shoot specialist who gets his threes off designed plays has a more predictable output than a shot-creator who generates threes off the dribble. The specialist’s volume depends on his teammates’ ability to create open looks; the creator’s volume depends on how the defence plays him individually. Those are different processes with different variance profiles, and the bookmaker’s model treats them similarly because it is anchored to the same historical data.
I pay close attention to one specific input: three-point attempt rate. A player who takes 35% of his shots from three, compared to one who takes 25%, has a higher floor on three-pointer makes simply because more opportunities create more outcomes. When I am evaluating a 3PM over, attempt rate is the first filter. High attempt rate plus soft defensive matchup plus a game total above 225 is my ideal profile for a three-pointer over play.
Volume vs Efficiency: What Drives the Over
Bettors aged 25 to 44 make up 65% of legal NBA wagers, and within that group the sharpest minds understand that three-pointer overs are driven by volume, not accuracy. A player who takes 10 threes and hits 30% makes three. A player who takes 6 threes and hits 40% makes 2.4. The less accurate, higher-volume shooter is more likely to clear a 2.5 line. This is counterintuitive for casual bettors who assume the “better” shooter is the better over bet, but the maths is clear: volume trumps efficiency for over props.
The key scenario for a three-pointer over is a fast-paced game against a team that allows high three-point volume. When the opposing defence is weak at closing out on the perimeter, shooters get more uncontested looks, which boosts both volume (more attempts because the shots are available) and efficiency (higher accuracy because the shots are open). That double uplift makes the over significantly more likely than the line implies.
The reverse — a slow-paced game against an elite perimeter defence — suppresses both volume and efficiency. Fewer possessions mean fewer shot attempts, and tighter contests reduce accuracy. I almost never bet three-pointer overs in those environments. The risk-reward profile favours the under, or better yet, passing on the market entirely and looking for value elsewhere on the prop board.
One pattern worth tracking: home versus road splits on three-point shooting. NBA players shoot slightly better from three at home than on the road — roughly 1-2 percentage points across the league. For a volume shooter, that small accuracy bump can translate into one additional made three across a 10-attempt night. Home games against weak perimeter defences are the sweet spot for three-pointer overs, and I weight my action accordingly.
Managing Variance on Three-Point Props
Variance is the reason most casual bettors abandon three-pointer props after a few bad nights. The standard deviation on 3PM is roughly 1.3 for a player averaging 3.0 per game, compared to about 5 for points and 2.5 for rebounds. In proportional terms, the three-pointer variance is enormous — you should expect the actual result to differ from the average by more than one made three about a third of the time. That means a player with a 3.5 line will go under on a significant number of nights even when the matchup, volume and form all pointed to the over.
The practical response to variance is not to avoid the market. It is to manage your stake sizing accordingly. I bet three-pointer props at half the unit size I use for points and rebounds props. The edge might be similar in percentage terms, but the volatility is higher, so the same unit size produces wilder swings in my bankroll. Half-sizing allows me to stay in the market through the inevitable losing streaks while still capturing the long-run edge.
Sample size is the other discipline. I never evaluate my three-pointer prop performance over fewer than 50 bets. At 20 bets, variance dominates and any apparent edge or weakness is noise. At 50-plus bets, the signal starts to emerge. If my three-pointer overs are hitting at 56% over 80 bets, I trust the process. If they are hitting at 56% over 15 bets, I trust nothing yet.
Hedging within a game is another variance-management technique. If I have taken a three-pointer over at 3.5 and the player has already made three with a full quarter remaining, I can cash out partially or place a live under to lock in a profit regardless of the final number. That in-game hedge is especially useful on nights when the player’s shooting is hot but his minutes might be capped by a blowout or foul trouble. Understanding the broader mechanics of player prop markets helps you decide when hedging adds value versus when it simply costs you expected profit.
Are three-pointer prop bets more volatile than points or assists props?
Three-pointer props are significantly more volatile. The standard deviation on made threes is proportionally much higher than for points or assists, meaning the actual result deviates from the average more frequently and more sharply. A player averaging 3.0 threes per game will produce results ranging from 0 to 6 or more on a regular basis. Manage this variance by using smaller stake sizes and evaluating performance over at least 50 bets.
How do defensive three-point percentages affect player prop lines?
Teams that allow a high three-point shooting percentage create favourable conditions for three-pointer overs, as shooters face less contested looks and get more open attempts. Conversely, elite perimeter defences suppress both volume and accuracy. The bookmaker partially prices this in, but the adjustment often lags for mid-season defensive changes caused by trades or injuries. Check the opponent’s recent defensive three-point stats over the last 10-15 games for the most current picture.
Written by the editors at nba Player Betting.